ReportsHow-to guide
Choose dashboard measures around the decisions your team makes
An operational dashboard earns its place when it helps someone decide what to do next. For an SME, the starting point is the meeting, responsibility or recurring problem behind the report. Choose a small set of measures that connect to those decisions, then make their definitions, source data and follow-up actions visible to the people using them.
Begin with the decisions made each week
Ask managers to describe decisions they regularly make with incomplete information. They might need to assign overdue work, investigate an order backlog, prepare purchasing or understand why a delivery commitment changed. Write each decision as an action with an owner and a time horizon. This is more useful than collecting every chart the reporting tool can produce.
Identify what the person can actually influence. A measure may be interesting without helping that role act. If a dashboard shows a problem that only another team can resolve, include the handoff to that team rather than leaving the reader with a coloured warning. Start with a few decisions from one operating area so the first version can be tested in a real meeting and refined through its use.
Define measures in terms the business can check
For each measure, specify the records included, the period, the relevant status and any exclusions. An overdue order count needs a definition of the promised date and what counts as completed. A backlog value needs an agreed treatment of cancelled or partially delivered orders. These choices should be explicit before anyone argues about the colour of the chart.
Name the business owner of the definition and keep a short explanation accessible from the report. Include the unit and the point in time represented by the number. If different teams need different definitions, show the distinction rather than forcing them into one ambiguous metric. A useful measure can be checked against underlying records by someone familiar with the process, without requiring a developer to translate hidden calculation logic.
Connect totals to records and responsible people
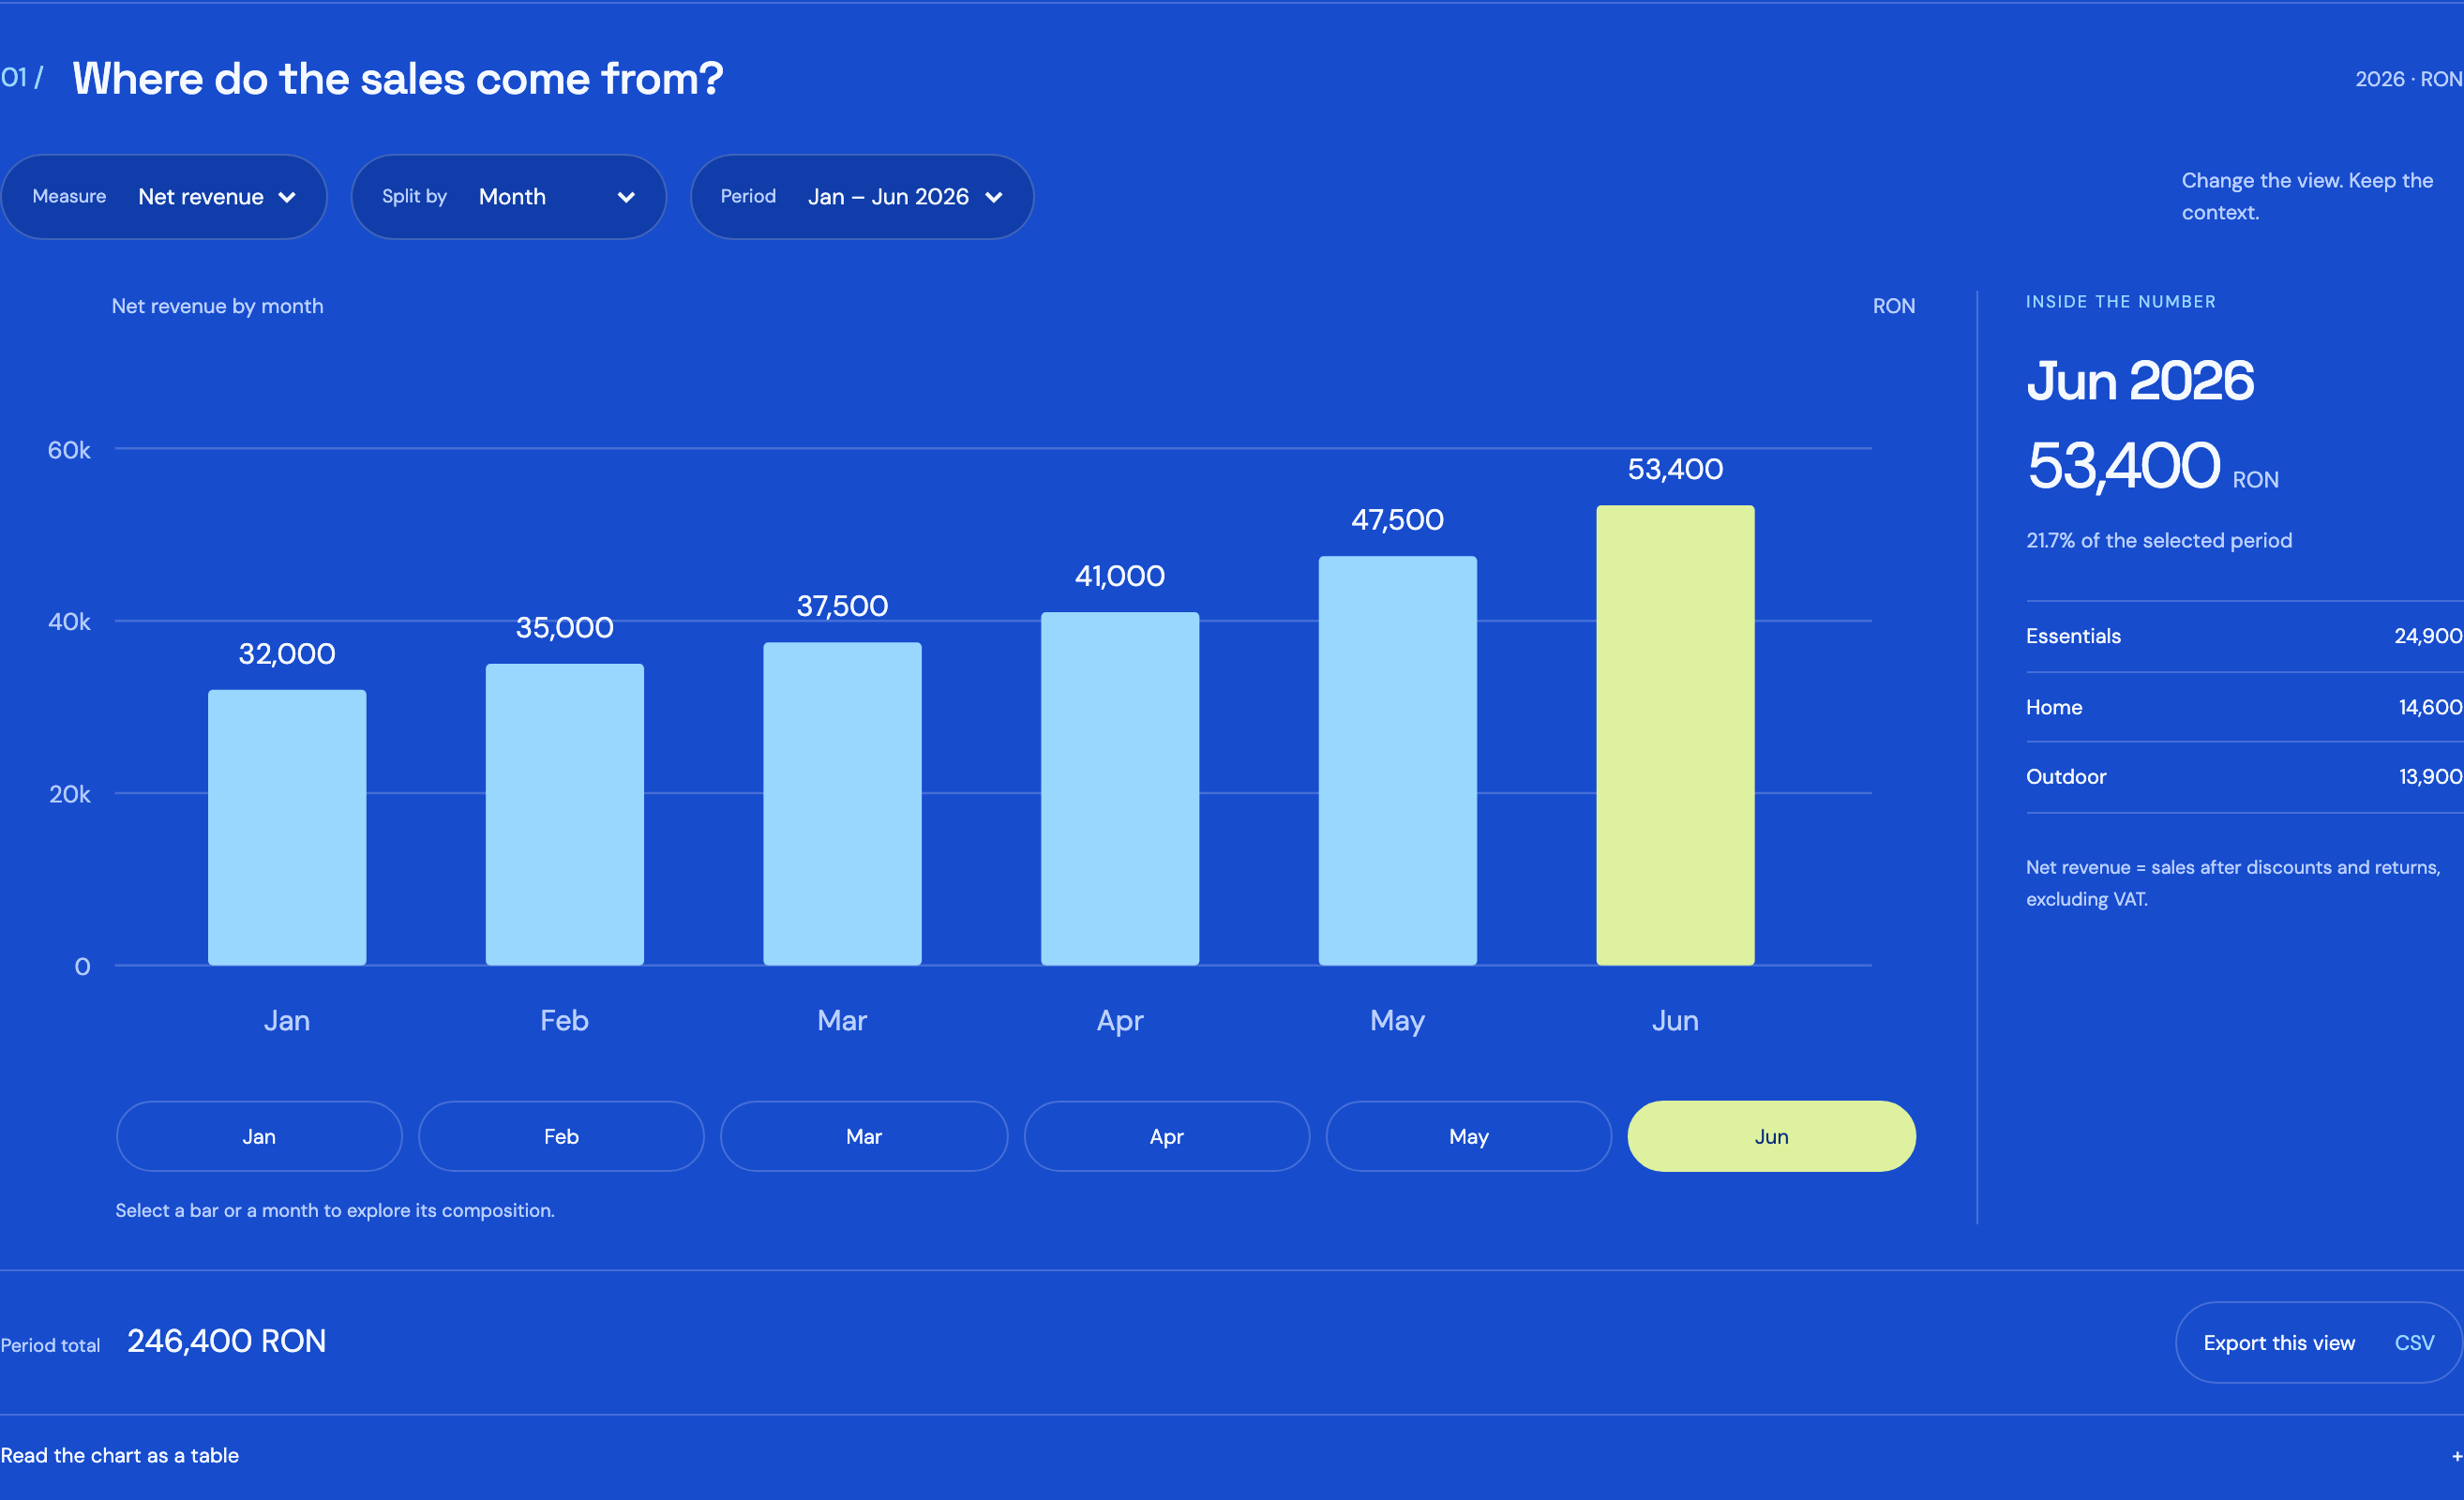
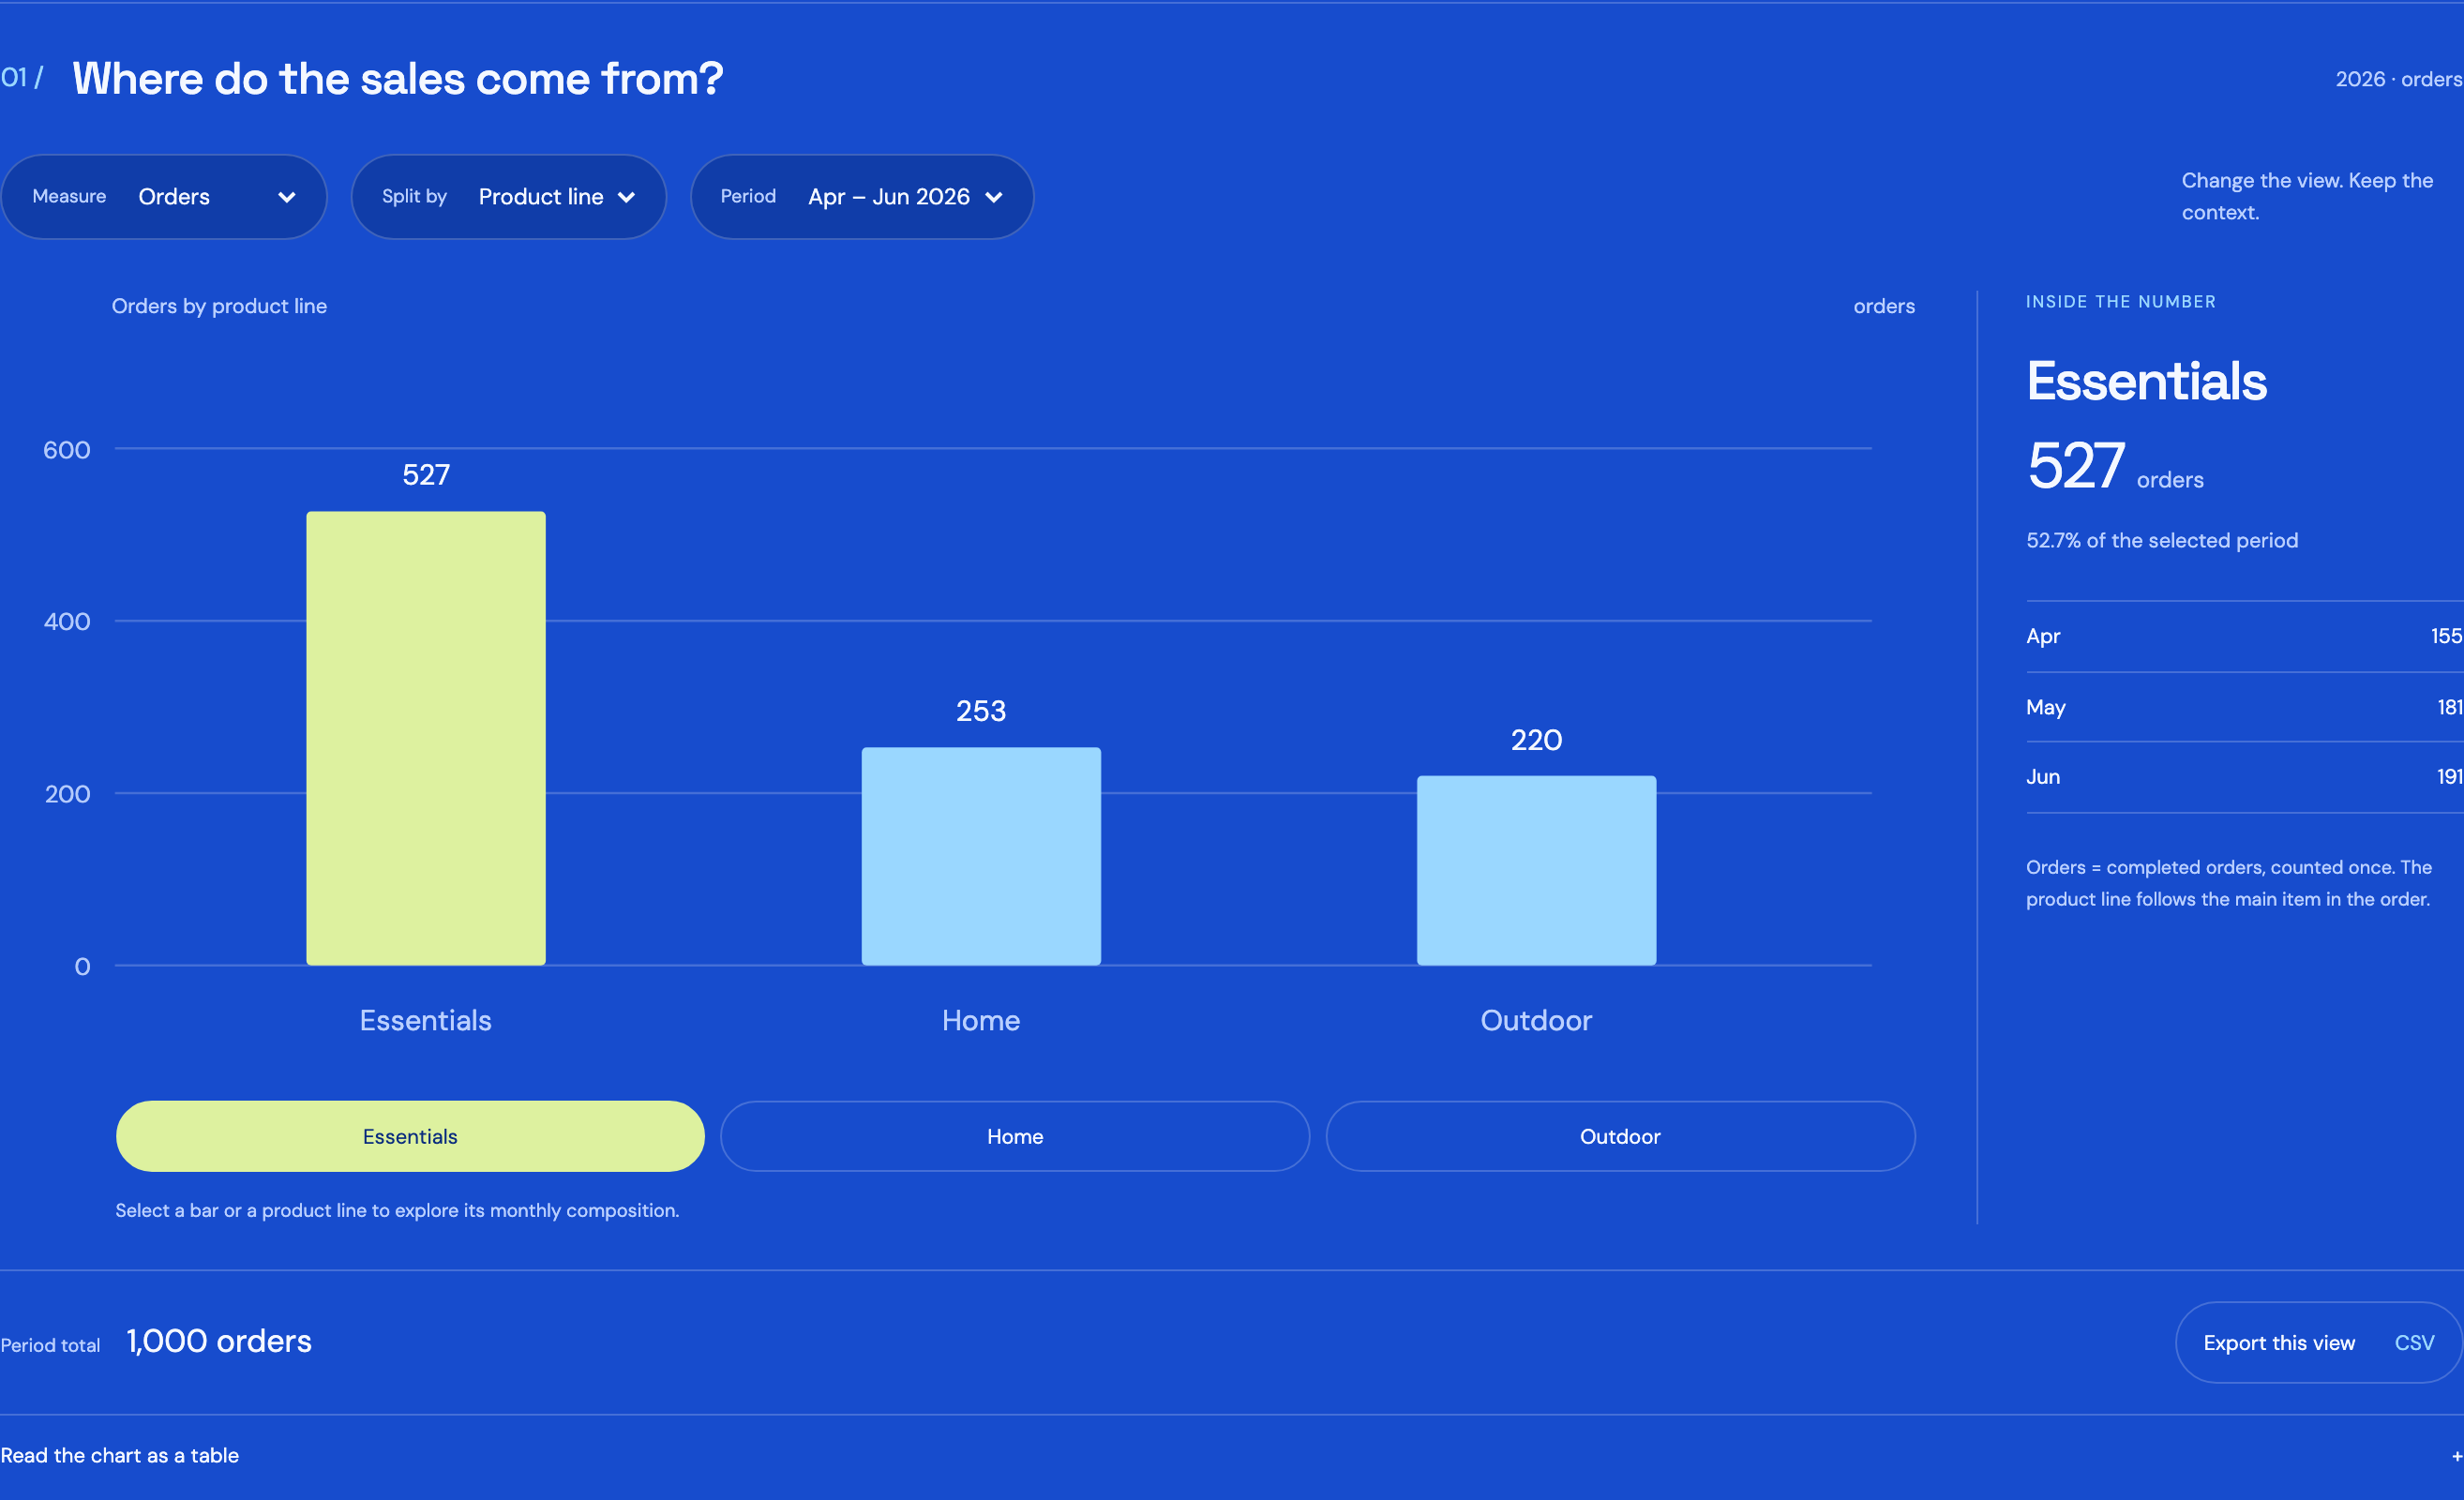
A manager seeing an increase in unresolved work needs to inspect the items contributing to it. Provide a controlled drill-down with the relevant order, task or exception references. The detail should preserve the filters and period from the summary so the person can explain why a row appears in the result.
Include ownership and the next operational step where these are part of the source process. A report should not create a separate shadow task system that quickly disagrees with the application where the team works. Link back to the authoritative record or route an action through an agreed integration. This lets the dashboard support decisions while the operational system continues recording who did what and whether the work is complete.
Make freshness and missing data visible
A number can be correct for yesterday and misleading for a decision made now. Show when the relevant source data was last obtained and whether the expected update completed. Different measures may have different refresh needs, so avoid one page-level timestamp that implies every source has the same freshness.
Handle unavailable inputs deliberately. A failed import should not quietly become a zero that suggests there is no work to do. Explain which measure is affected and who is responsible for restoring the source. Use a readiness checklist with the people who will read the dashboard so they can distinguish a business exception from a reporting problem.
- State the decision and the person responsible for acting.
- Define the population, status, period and unit for each measure.
- Provide a route from a total to the contributing records.
- Show source freshness and incomplete updates explicitly.
- Identify the action or handoff that follows an exception.
Design the meeting around follow-through
Test the dashboard in the meeting it is intended to support. Ask a participant to explain a changed value, inspect the relevant records and identify an action. Observe where they need another export or a separate conversation to understand the result. Those gaps often reveal a missing definition or relationship more clearly than a design review conducted in isolation.
Record decisions in the appropriate operational system and review whether earlier actions were completed. Avoid treating dashboard visits as the main success measure. Better evidence includes fewer unexplained figures, a clearer owner for exceptions and less preparation required to reach a decision. These are outcomes to measure in the organisation’s own process, not guaranteed improvements that can be promised from the appearance of a new reporting page.
Choose the delivery model that the team can maintain
RDC can connect the relevant sources, define the reporting model with business owners and build a dashboard around the selected decisions. Compare tools through access controls, export needs, refresh capabilities, licence costs and the ability to explain where a number came from. The best choice depends on the systems and maintenance capacity already present in the company.
EU-hosted and company-managed options should cover the data pipeline as well as the visible dashboard. Specify who monitors imports, approves definition changes and restores the reporting service. Rehearse a changed source field, a late update and a user with limited access before release. Bring a recent management agenda, the spreadsheets prepared for it and the questions that remain unanswered after the meeting. They provide the basis for operational reporting that connects information to accountable action.
Inside the product
Reports
Follow the references
Sources & inspiration
AntWMS
Devpost project by Mohammad Rafaquat Alam
Independent inspiration for workflow design.
This independently created project is credited as inspiration. The workflow and implementation guidance in this article are RDC’s analysis.
Put the guide to work
Start with your workflow.
Tell us what your team needs to do, which systems are involved and where the current process slows down.