ReportsWorkflow
When two reports disagree, follow the data back to its source
When two reports show different totals, the fastest useful question is what each report actually counts. Sales and finance may use different events, periods or statuses while both calculations are internally consistent. Trace the difference back to source records before changing a formula, then make the explanation visible so the same disagreement does not return at every meeting.
Freeze the comparison before investigating
Record the two report versions, their filters, the viewing time and the values being compared. If one report refreshes during the investigation, the team can otherwise end up explaining a difference that no longer matches the original question. Keep a reproducible snapshot or equivalent query reference according to the reporting tools and the organisation’s access rules.
Ask each report owner to describe the business meaning of the total. An order value, an invoiced value and a received payment are different measures even when a dashboard gives each a short sales label. Write down the intended comparison and which common population would make it meaningful. This step often narrows the investigation more effectively than immediately inspecting every transformation in the data pipeline.
Align period, time zone and business event
Check which date assigns a record to the period. Order creation, dispatch, document issue and payment confirmation can fall on different days. A month selected in two interfaces does not prove that they use the same event. Record the date field and boundary conditions used in each calculation, including how late-posted or corrected records are treated.
Review time zones and the meaning of timestamps when systems cross regions or update overnight. A transaction close to midnight may belong to different calendar days under different interpretations. Do not silently force one report to match the other by shifting dates. Have the responsible owners agree the comparison rule, then preserve any legitimate difference between an operational view and a separately governed finance view.
Compare inclusion rules before comparing arithmetic
List the statuses included by each report: open, approved, delivered, cancelled or otherwise classified in the source process. Partial fulfilment and later corrections can change which amount belongs in the chosen measure. Check whether the report counts whole documents, individual lines or another unit, because joining those levels incorrectly can duplicate contributions.
Look at exclusions and missing relationships. A record without a mapped customer or product may be omitted from one report and grouped under unknown in another. Neither behaviour should remain invisible. Identify the affected records and their value contribution before deciding whether the source mapping or the reporting rule needs correction. The calculation should have a documented place for unresolved data rather than allowing it to disappear without explanation.
Build a bridge from one total to the other
Create a reconciliation view showing the shared records and the categories that explain the difference. Useful categories might include records present only in one source, different period assignment, changed status or different value treatment. Use the company’s actual data to quantify them and retain references for reviewers. The purpose is to account for the gap, not merely display two numbers beside each other.
Apply the checklist in a fixed order so the team can repeat the investigation after a change. Arithmetic should be checked, but it should come after the business population and representation are understood. If currency conversion is involved, finance should confirm the rate source and date rule used for its comparison.
- Confirm that both totals represent the same intended business measure.
- Align period boundaries and the event date being used.
- Compare included statuses, line levels and exclusions.
- Identify unmatched records and their contribution to the gap.
- Verify agreed currency and rounding treatment where relevant.
- Preserve source references for every explanation category.
Follow transformations and refresh dependencies
Trace the report through extracts, transformations and intermediate datasets to the originating system. Record which step changes identifiers, filters statuses, converts values or combines sources. A visible lineage map helps the team identify where a definition was applied and who owns the relevant transformation. It does not replace checking the actual records that produced the disputed number.
Show the freshness of each dependency. One dataset may have completed its update while another still reflects an earlier extraction. In that case, the apparent disagreement may be a timing issue rather than a formula defect. Keep failed and partial updates visible, and define whether the dashboard should retain a clearly dated previous result or withhold the affected measure until the input is complete.
Turn the explanation into a maintained reporting rule
Once the difference is understood, decide whether the reports should converge or intentionally remain distinct. Update labels and definitions to explain legitimate differences. Where a defect is found, correct the responsible source or transformation and rerun the reconciliation on the same comparison period. Check adjacent periods and affected dimensions when the changed rule could alter them too.
RDC can connect source references, build reconciliation views and make refresh dependencies observable. Scope EU-hosted or company-managed reporting with access controls, export handling, retention and ownership of the data pipeline. Measure recurring unexplained differences, time to identify a cause and data issues awaiting an owner. Bring the two reports, the original filters and a few records whose treatment differs. That evidence turns an argument about totals into a specific investigation with a result the business can verify.
Inside the product
Reports
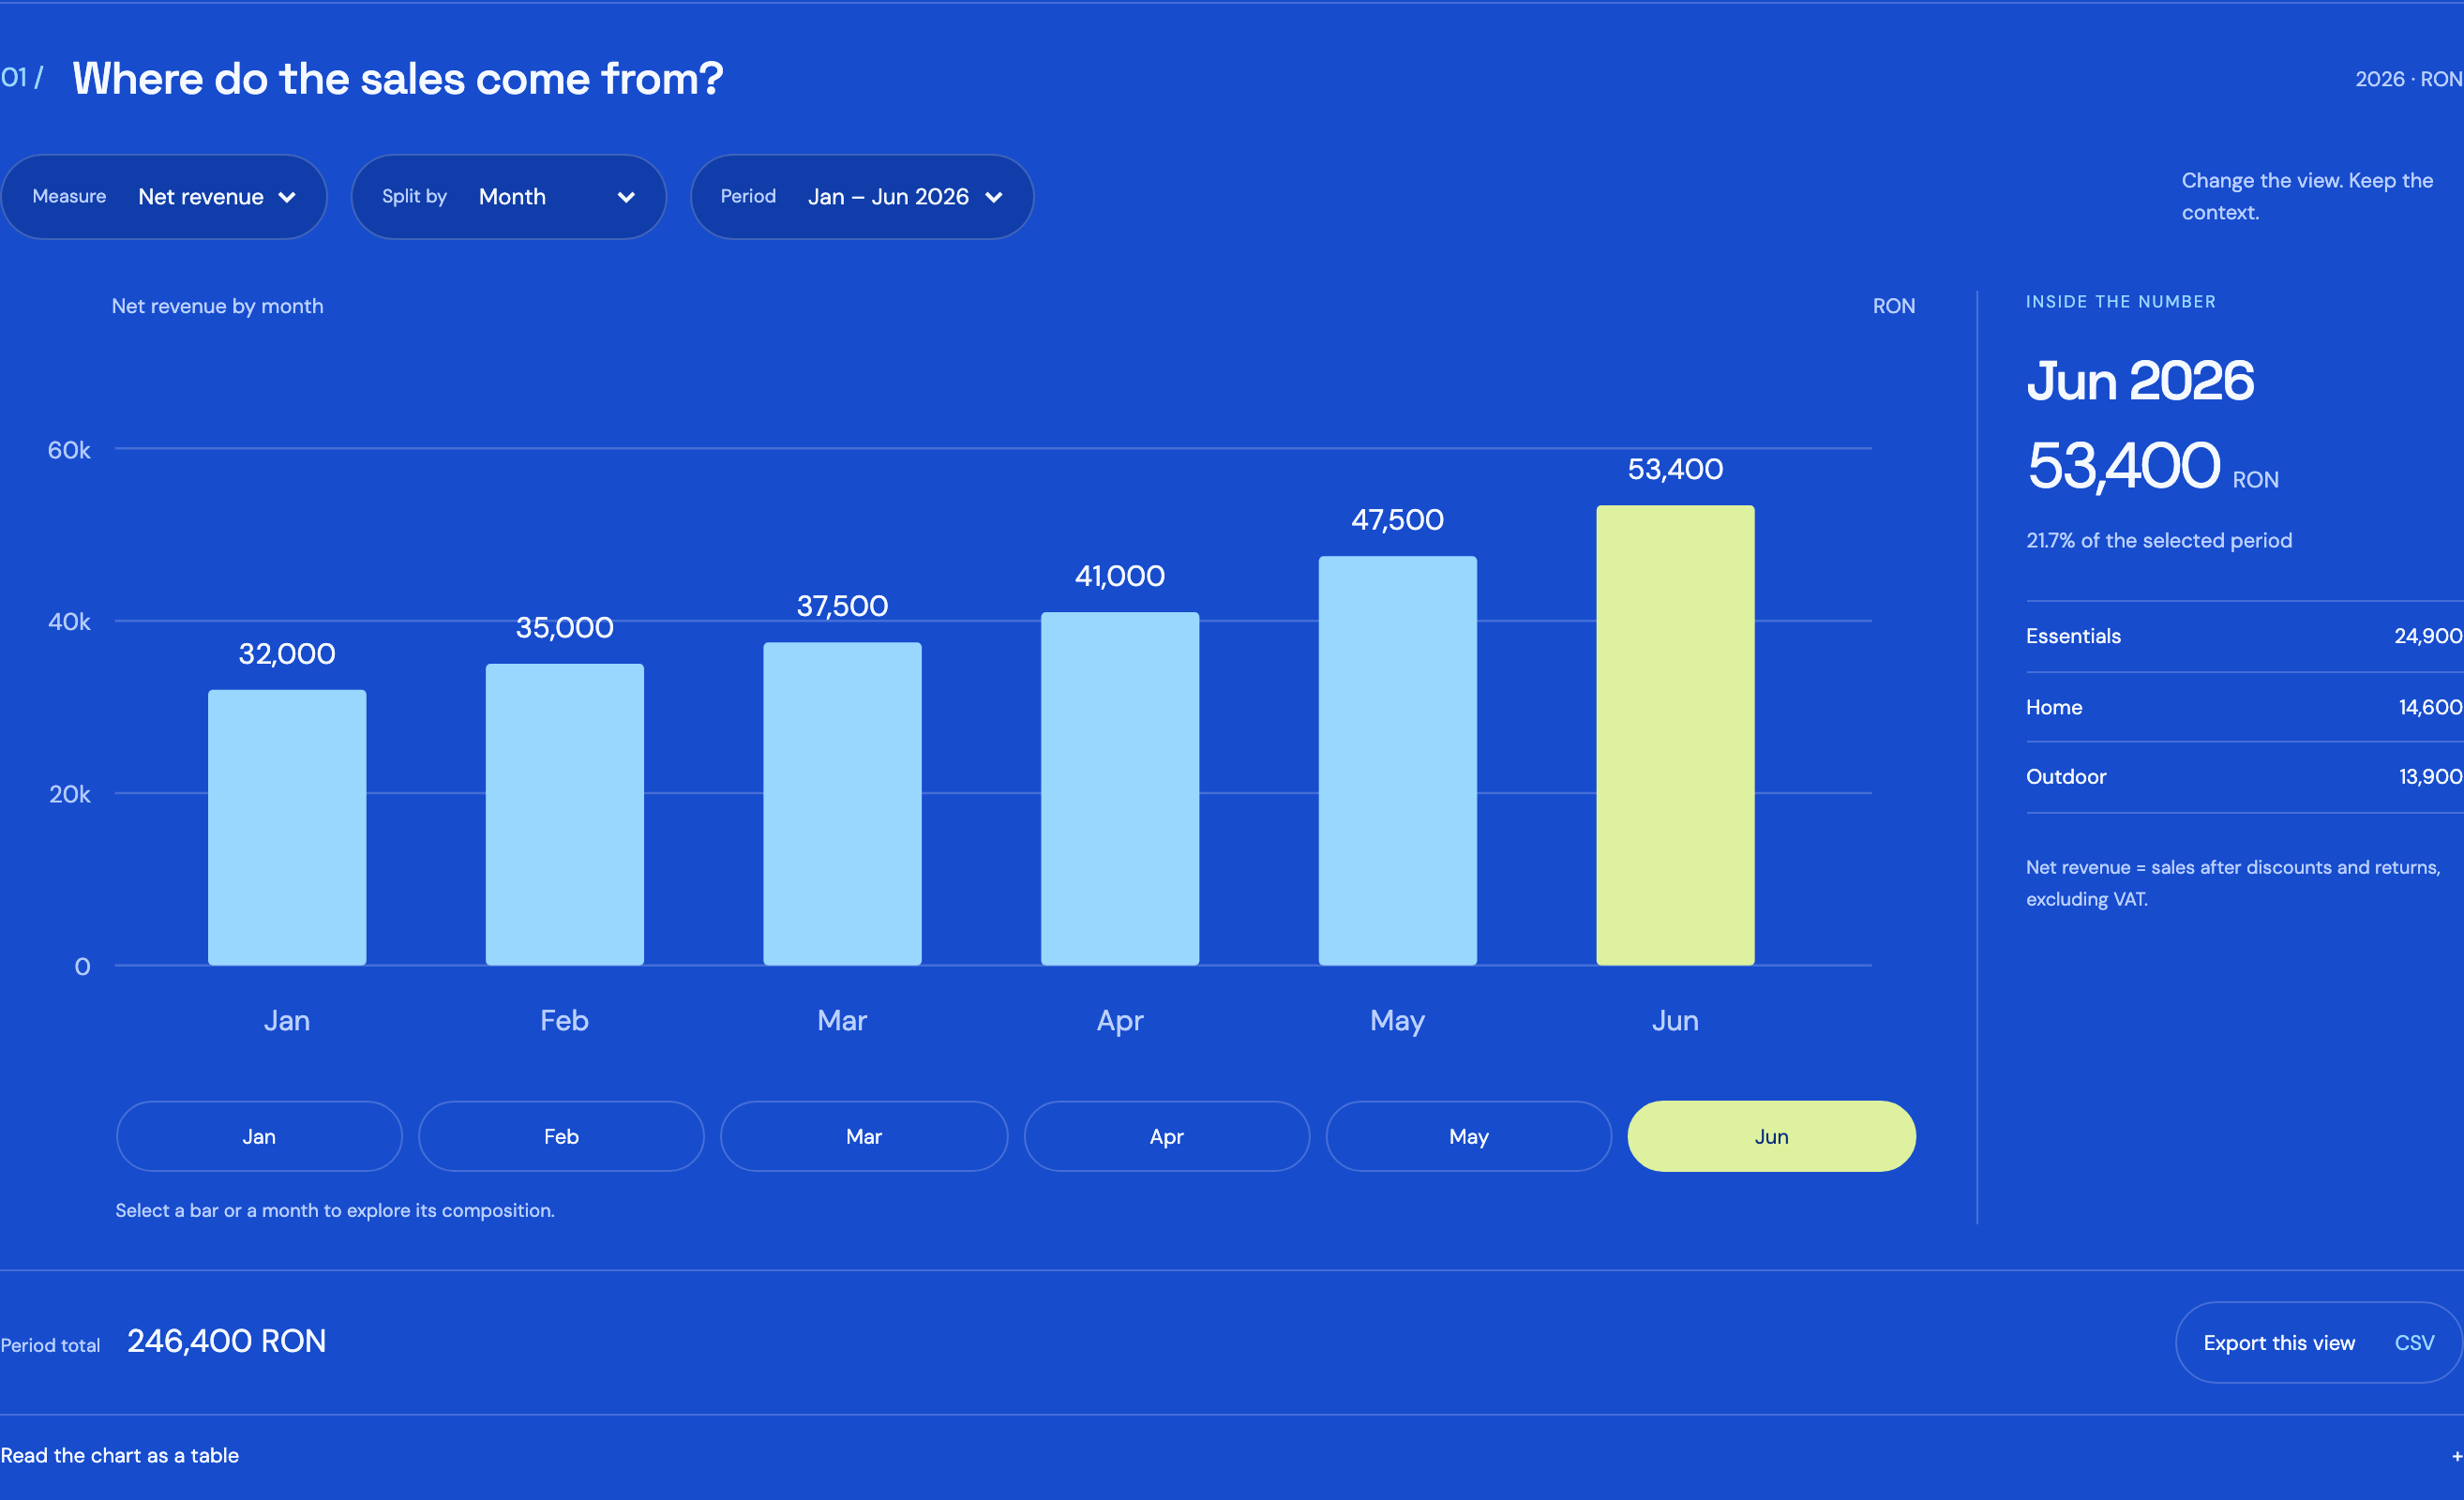
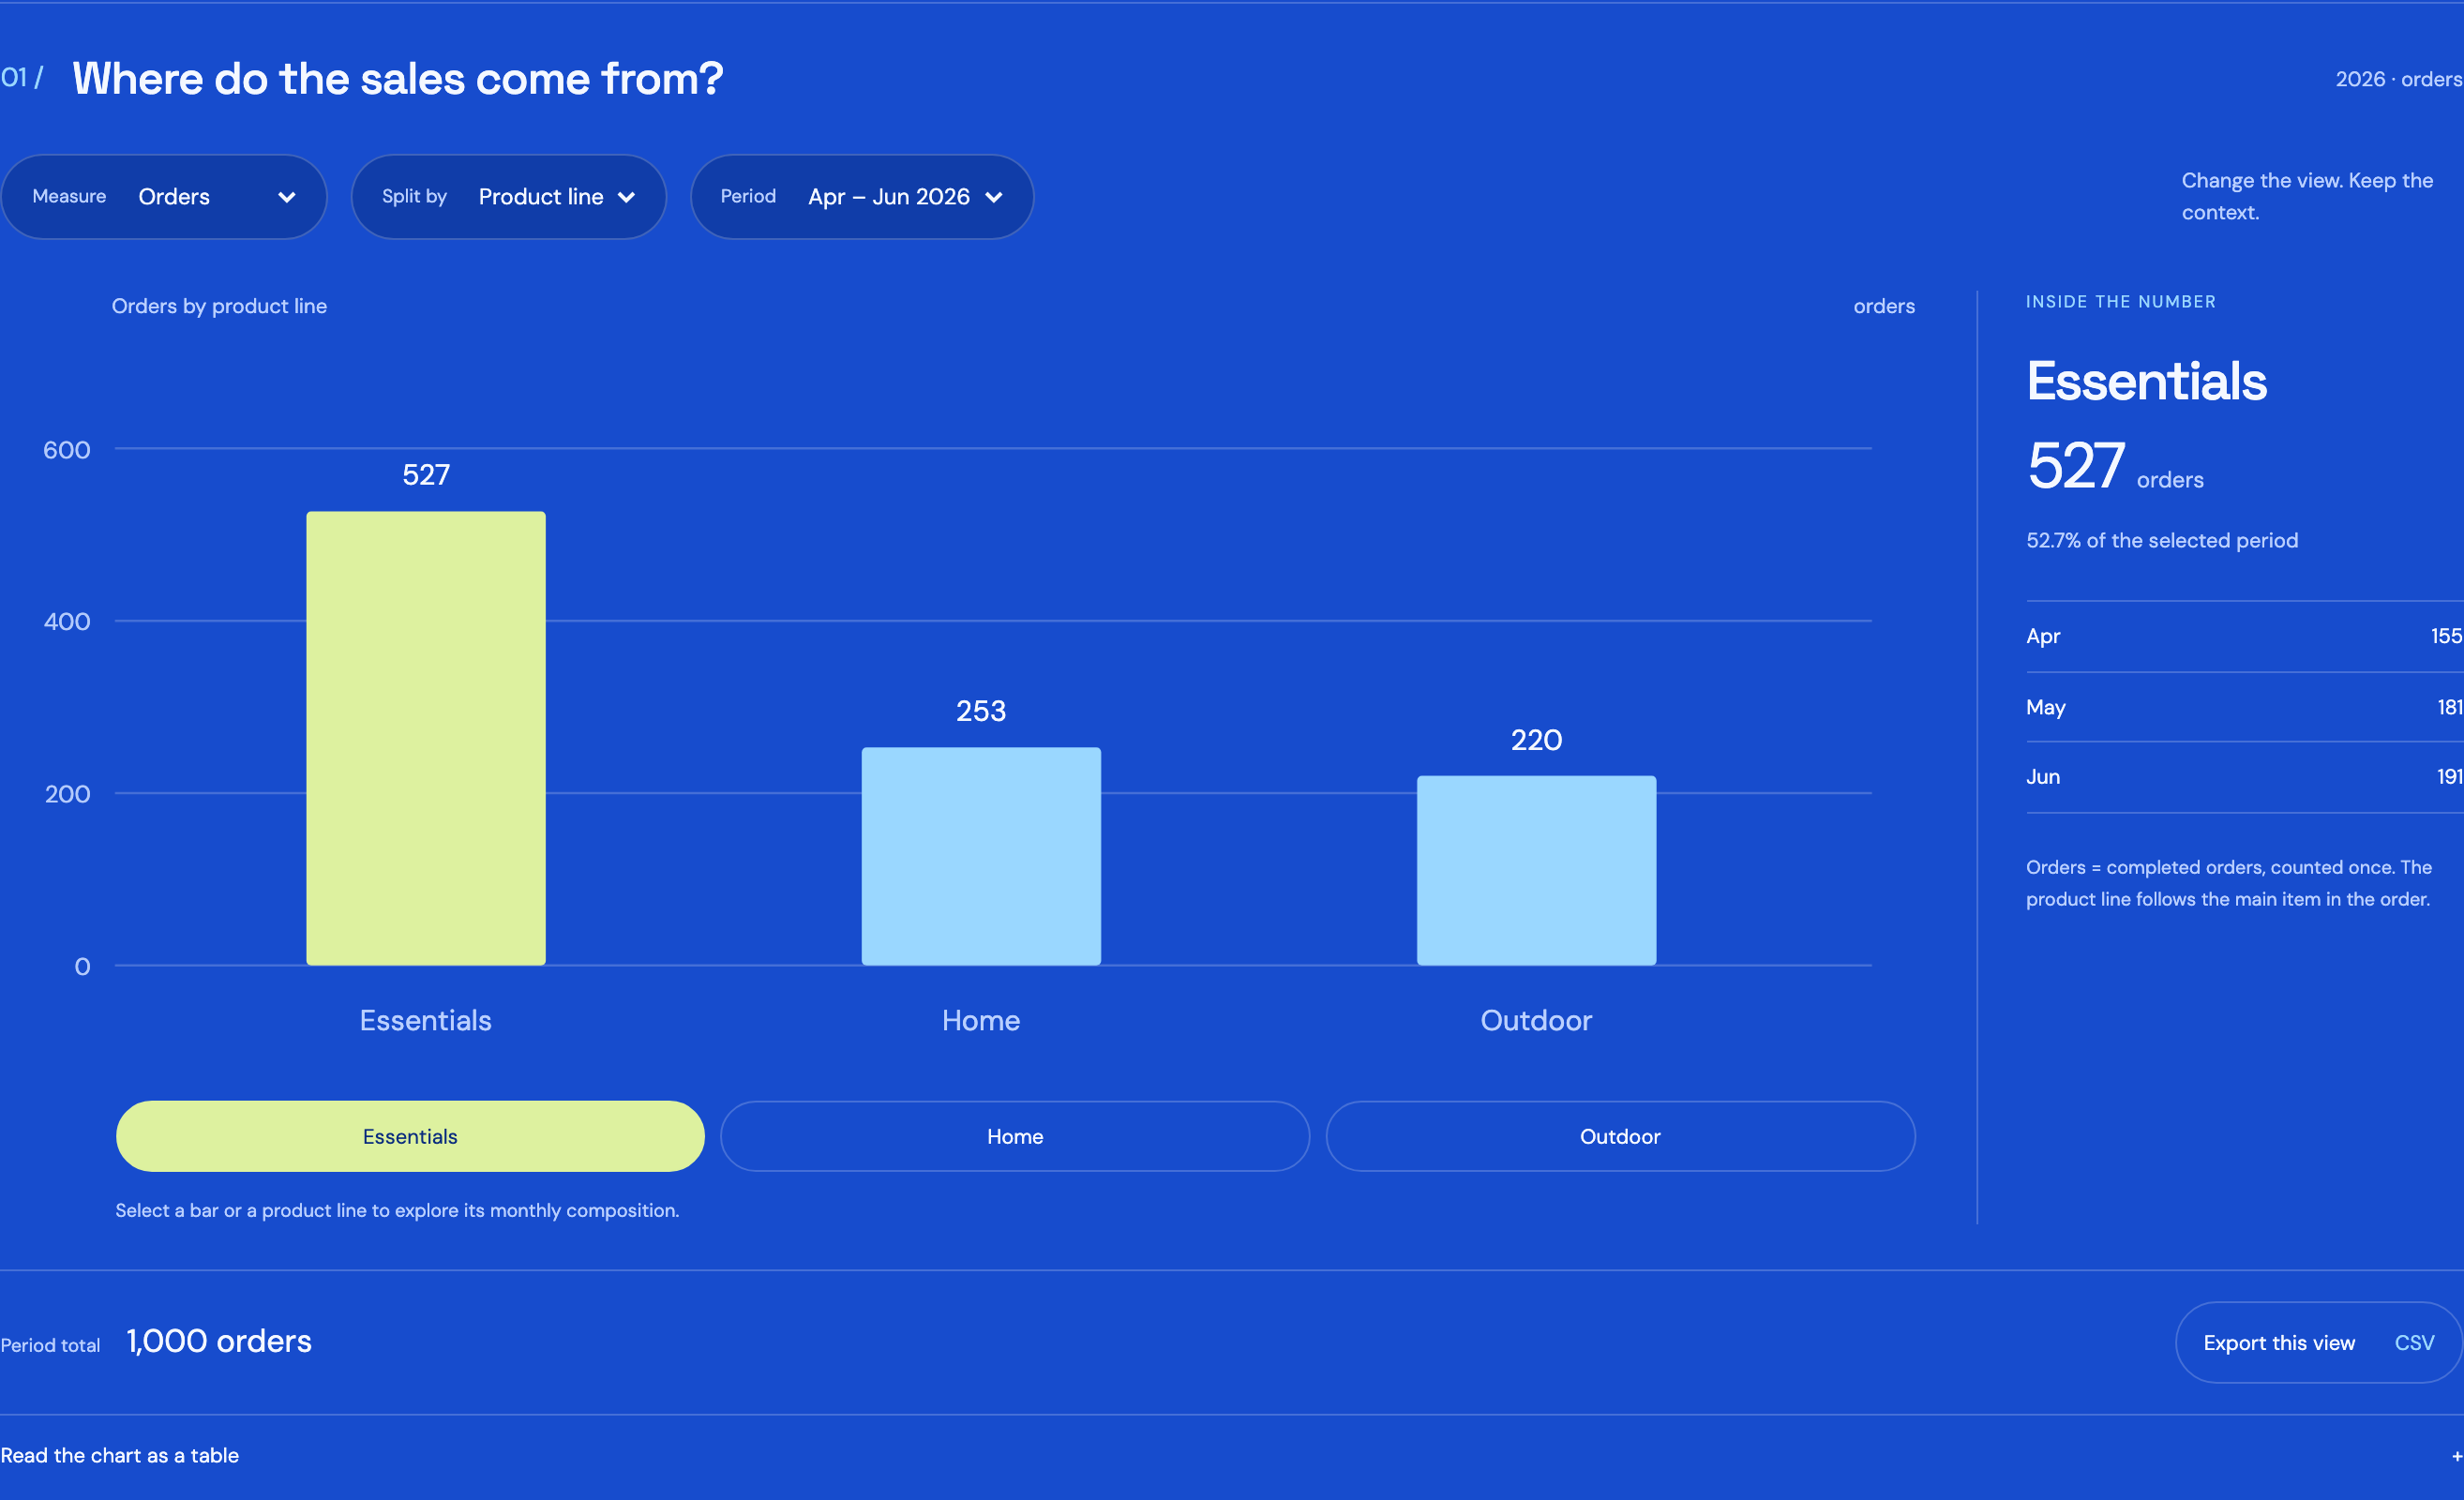
Follow the references
Sources & inspiration
ReconFlow
Devpost project by Aditya Jain, Rachit Bhatia, Nisarg Gandhi
Independent inspiration for workflow design.
This independently created project is credited as inspiration. The workflow and implementation guidance in this article are RDC’s analysis.
Put the guide to work
Start with your workflow.
Tell us what your team needs to do, which systems are involved and where the current process slows down.